Architecture diagrams, without the busywork
Turn your codebase into a clear diagram.
Paste a GitHub URL or describe your system in plain English. OverViz analyzes the architecture and generates a clean, publication-ready diagram.
Input
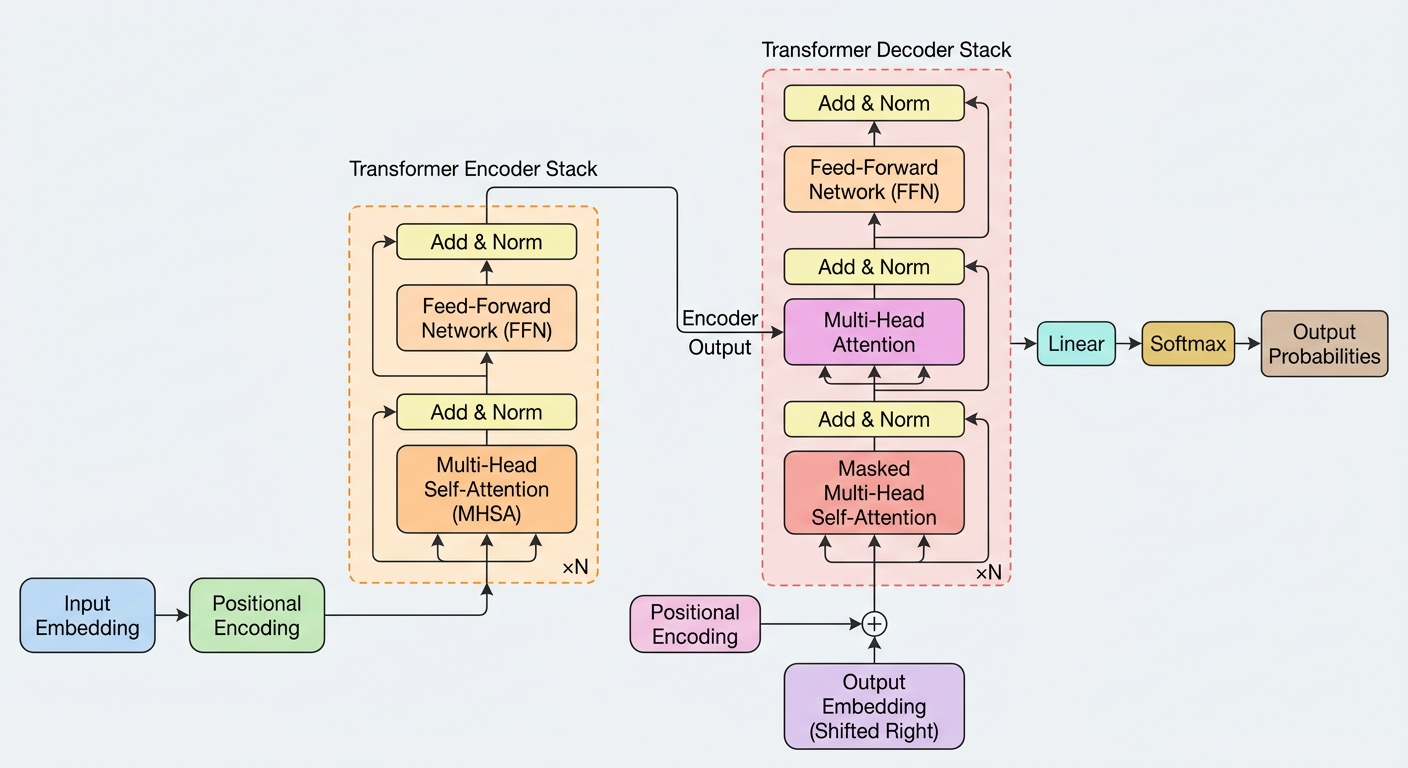
The Transformer architecture (encoder-decoder):

1. Input Embedding + Positional Encoding
2. Encoder - N blocks of Multi-Head Self-Attention
   and a Feed-Forward Network, each with Add & Norm
3. Decoder - Masked Self-Attention, cross-attention
   over the encoder output, and an FFN (×N)
4. Output - Linear → Softmax → probabilities
Generated diagram
How it works
Three steps to a finished diagram
No design tools, no manual layout. Describe the system and download the result.
01
Provide your input
Paste a public GitHub repository URL, or write a short plain-English description of your architecture and tech stack.
02
OverViz analyzes it
The model identifies the components, frontends, services, APIs, databases, caches, and how they connect.
03
Generate & download
Pick a style, generate, and download a high-resolution PNG, ready for papers, docs, and presentations.
FAQ
Frequently asked questions
Architecture diagrams for research papers, technical documentation, presentations, and design reviews, anywhere you need a clear system diagram without opening a drawing tool.
No. Describe your architecture in plain English or paste a GitHub URL, and OverViz handles the layout and visual design.
Currently only public GitHub repositories. For private code, use the description option instead.
High-resolution PNG, generated at publication quality with no watermarks.
Ready to visualize your architecture?
Describe your system and get a diagram in seconds.